Why your architecture diagrams are failing (and how C4 fixes them)
9 August 2026 · 4 min read
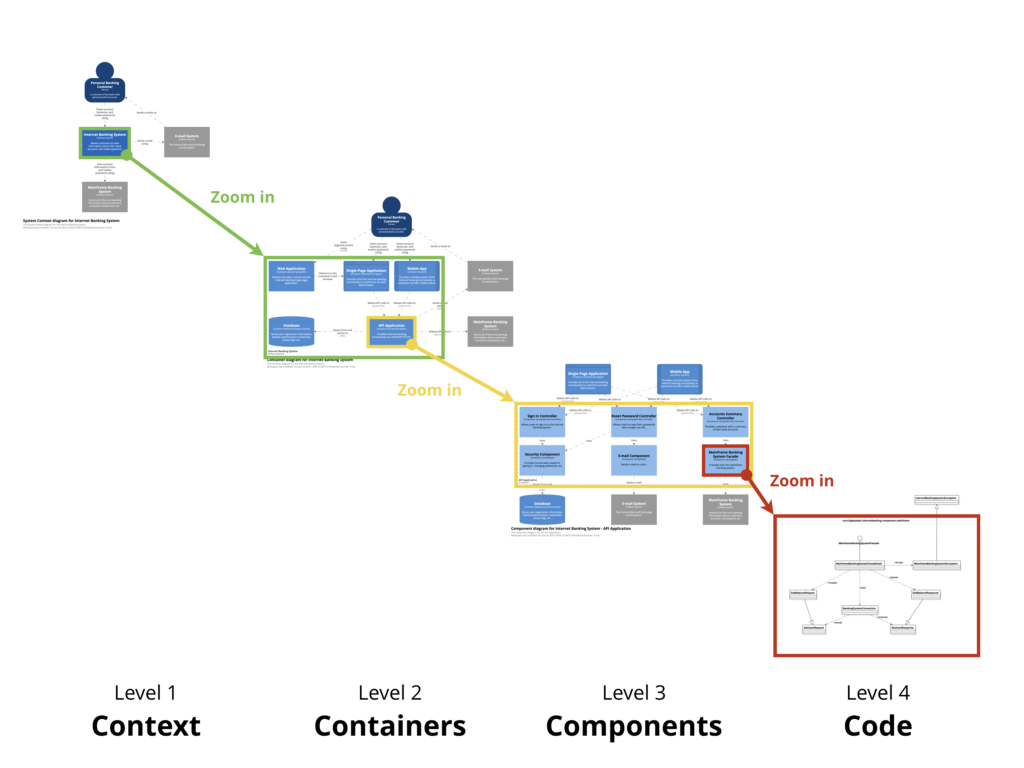
If you ask five engineers to draw a diagram of the same cloud architecture, you’ll usually get five wildly different pictures. One draws a detailed AWS network topology with subnets, NAT gateways, and security groups. Another draws boxes labelled “Frontend”, “Backend”, and “Database” connected by mysterious arrows. A third mixes physical infrastructure with high-level business capabilities on a single canvas.
The problem isn’t that these engineers don’t understand the system. The problem is that traditional software diagramming lacks a common abstraction layer and a consistent notation. This is where Simon Brown’s C4 model comes in.
The Core Concept: Maps, not schematics
Think of the C4 model like Google Maps. You don’t look at a world map to find street-level parking, and you don’t look at a neighbourhood street map to navigate across continents.
The C4 model structures system architecture into four hierarchical levels of abstraction: System Context at the top, then Containers, then Components inside a single container, then Code — classes, interfaces, and functions. By separating concerns by zoom level, every reader gets the exact degree of detail they need, without cognitive overload.
The 4 Levels Explained
Level 1: System context
The audience is non-technical stakeholders, product managers, domain experts, and new engineering hires. The question it answers is what the system is, who uses it, and what external services it integrates with. What to show: the core system as a single central box, surrounding actors — users and roles — and key external integrations such as a payment provider, an identity service, or a third-party API.
If a business executive can’t understand your context diagram in 30 seconds, it has too much detail.
Level 2: Container diagram
The audience shifts to software engineers, cloud architects, and DevOps or SRE teams. The question it answers is what the high-level technical building blocks are. What to show: applications, data stores, API gateways, serverless workers, and queues. In C4 terminology a “container” means an executable building block — a Lambda function, a React SPA, a Postgres database — not specifically a Docker container.
Each container should state its technology choice, such as Node.js or DynamoDB, and its communication protocol, such as HTTPS/REST or SQS/EventBridge.
Level 3: Component diagram
The audience narrows to developers working directly inside that specific container or service repository. The question it answers is how that application or microservice is structured internally: key modules, controllers, command handlers, or domain services.
Only build Level 3 diagrams for critical or complex containers. Documenting every standard CRUD microservice down to this level creates maintenance overhead without adding insight.
Level 4: Code
The audience is developers writing or refactoring specific implementation details. The question it answers is how a component is implemented at the code level — class diagrams, entity-relationship diagrams, or sequence flows. The best practice is to generate these views dynamically from code, using TypeScript interfaces or Mermaid sequence diagrams, rather than drawing them by hand. A hand-drawn Level 4 diagram goes stale the moment the code changes.
Why C4 fits serverless particularly well
In event-driven and serverless architectures, traditional UML sequence diagrams quickly become unreadable. C4 fits naturally for three reasons: decoupled execution units map directly to Level 2 containers — API Gateway, EventBridge, Lambda functions, S3 buckets; event flows become explicit, labelled relationships between containers, such as a service publishing an OrderPlaced event through EventBridge; and diagrams-as-code tooling like Structurizr or PlantUML lets you store architecture diagrams in Git alongside the infrastructure-as-code templates that implement them, so the two evolve together instead of drifting apart.
What separates a diagram that lasts
A few habits separate C4 diagrams that stay useful from the ones abandoned after the first sprint. Give every box an explicit type and technology — never leave one labelled just “database” or “processing engine”. Make every arrow unidirectional and descriptively labelled, such as Uses [HTTPS/JSON], instead of a blank double-headed line. Limit colour coding to semantic meaning, distinguishing your system from external systems or legacy boundaries rather than using it for visual flourish. And keep diagrams in source control, reviewed alongside the pull requests that change the architecture they describe.
The value of C4 isn’t the notation itself — it’s the discipline of matching the diagram to the audience. A context diagram for a stakeholder and a component diagram for a developer are both correct; the mistake is drawing one when the room needs the other.